

B2B SaaS Marketing Strategy: Find the Constraint First

By Brian Shelton — Founder of GrowPredictably.com
TL;DR: One stage of your customer journey caps growth, and the number of channels you run has almost nothing to do with it. Find the stage where accounts fall out fastest, concentrate budget there, and deliberately underfund everything else until that stage stops being the worst one. In B2B SaaS the capping stage is often the handoff to sales, which sits across an ownership line, which is why nobody fixes it.
Key Takeaways
- If your strategy does not tell you what to stop funding, you have a plan.
- The top-ranking guides for this term offer between five and sixteen tactics. None of them tells you which to run first.
- Stage conversion rates have to measure whether an account advanced. Counting individual clicks mis-reads every stage.
- Your CAC payback number is unreadable until you name your contract size.
- The constraint is often the marketing to sales handoff, which sits across an ownership line where neither side can fix it alone.
Every flat quarter looks the same from the inside. Six channels are live, the team is busy, spend is level or up, and the pipeline chart has not moved since spring. Nobody is being lazy. The content is shipping, the ads are running, the sequences are sending. And still the number sits there.
This is written for a B2B SaaS founder or head of growth with a real budget and no slack in it, staring at that chart and being asked why. If you have already run the standard plays and they have already stopped working, you did not miss a tactic. The problem sits upstream of the tactic list.
I have watched marketing leaders hire and fire digital marketing agencies for fifteen years, from both the agency side and the in-house marketing-leadership side, and the same pattern shows up almost every time the relationship goes bad. Nobody diagnosed anything.
Somebody bought activity, the activity ran, and when the number did not move the answer was more activity. What follows is the diagnosis that should have happened first.
What is a B2B SaaS marketing strategy?
A B2B SaaS marketing strategy is a decision about where to concentrate finite budget across the stages a buying account moves through, from never having heard of you to renewing and expanding. It is one choice, made deliberately, about which of those stages receives the money and attention this quarter.
That definition is doing more work than it looks. It says a strategy is an allocation decision. Which means the test of whether you have one is simple, and most teams fail it: if your strategy does not tell you what you are going to stop funding, you do not have a strategy. You have a plan.
A plan lists what you will do. A strategy says what you will do instead of something else. The instead is the whole thing.
Three things a real B2B SaaS marketing strategy has to specify:
- The constraint. Which single stage of the journey is holding output down right now.
- The concentration. Where the next increment of budget and attention goes, and what goes flat or paused to pay for it.
- The proof. The one metric that will move if you were right, and roughly when.
If a document cannot answer those three, it is an activity calendar wearing a strategy label. Useful for coordination, because everyone knows what is happening this month, but useless for growth, because nothing in it explains why this month’s work should produce a different result than last month’s.
Notice what is not in the definition. There is no channel list, and no mention of content, paid, outbound, events, or partnerships. That is deliberate, because those are the instruments rather than the strategy.
The strategy is the decision about which instrument to point at the problem, and that decision cannot be made from a menu, since a menu tells you what is available and says nothing about what is wrong.
Why is a list of sixteen tactics not a strategy?
Search the term and count what comes back. The top-ranking guides offer five tactics, then eight, then ten, eleven, twelve, and sixteen. Every one of them is competent, well researched, and perfectly reasonable in isolation. Not one of them tells you which to run first, or what to stop doing to pay for it.
That is the whole problem. You arrived with a fixed budget and a flat chart. You leave with a longer to-do list.
Richard Rumelt, who teaches strategy at UCLA and wrote Good Strategy / Bad Strategy, puts the failure upstream of the list.
To deal with the issue, you have to decide on the diagnosis.
Richard Rumelt, in conversation on Lenny’s Podcast
Most B2B SaaS marketing plans never decide. They go straight to activity, because activity is easier to get approved than a diagnosis that tells someone their favorite channel is not the problem.
Strategy fails at the diagnosis, not at the tactic list.
There is a second problem buried in those guides, and it is specific to you. Most are written for SaaS in general, so they carry plays built for self-serve products where one person can discover, decide, and pay inside a single session. Your buyer cannot. A committee decides, over months, with a sales conversation somewhere in the middle.
Running a self-serve play against a committee purchase wastes money and, worse, measures the wrong thing, then reports back that the channel is working.
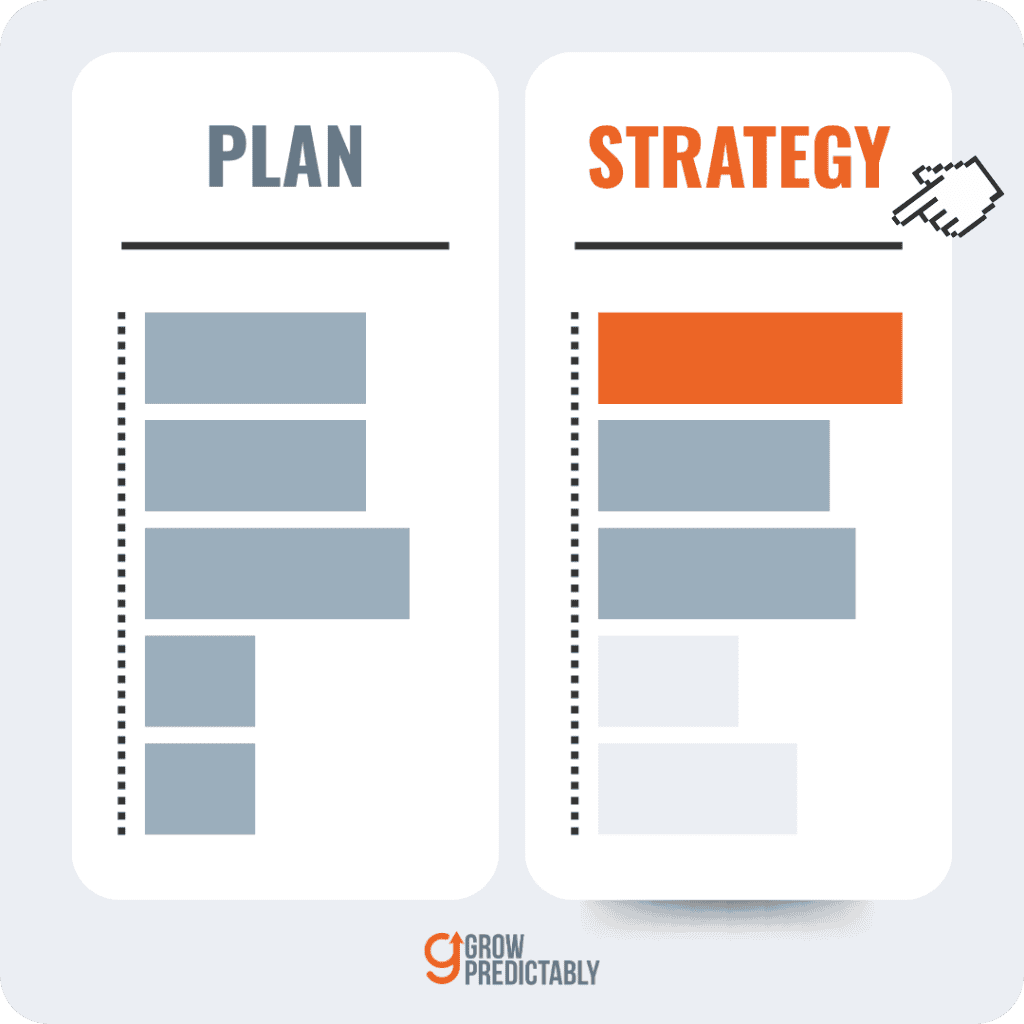
Running all sixteen at partial strength is how a team gets busy and stays flat, because none of the sixteen receives enough investment to clear the bar where it would actually change a number. Speed means nothing if the direction is wrong, and when anything is possible, priorities define you.
There is a reason this failure is so persistent, and it is not incompetence. A tactic list is safe to approve. Nobody has to be told their work is being paused, no channel owner has to defend their budget, and the plan can be circulated without an argument.
A diagnosis is the opposite: it names a stage, which implicitly names the people whose work is not the priority this quarter. That is uncomfortable, so teams avoid it, and the avoidance is what produces the flat chart.
So the real question is which one stage of your journey is holding the whole thing down, and what you are willing to stop funding in order to fix it.
How is B2B SaaS marketing actually different?
Three structural differences change the diagnosis itself, and they run deeper than tone of voice. A committee decides rather than an individual, the revenue arrives over years rather than at checkout, and most of the buying happens in rooms you are never in.
Each one changes the arithmetic of which stage is worth funding.
The unit that converts is an account
In self-serve SaaS, a conversion is a person doing a thing. In B2B SaaS, the unit that converts is an account, and inside that account sit people who never fill in a form, never click an ad, and never appear in your attribution report. They still decide.
Edelman and LinkedIn’s 2025 B2B Thought Leadership Impact Report, now in its seventh year and drawing on nearly two thousand global professionals, found that misalignment inside the buying group makes these hidden buyers a real risk, and that strong thought leadership is what reaches the decision-makers you otherwise never see.
The practical consequence runs through the rest of this article. Every stage conversion rate you calculate has to answer “did this account advance,” not “did this person click.” Teams that count individuals do not get a slightly noisy read.
They get a wrong one, because a single champion generating twelve touches looks identical to twelve stakeholders engaging once, and those are opposite situations.
You are buying a renewal stream, not a purchase
The second difference is that acquisition only pays back over time. An acquisition win with poor retention is a loss, booked slowly enough that it takes three quarters to notice.
That is why the metrics that bind change as you grow. ProductLed’s State of B2B SaaS 2025, an analysis of 446 companies, found that as B2B SaaS companies scale, the indicators that actually bind shift toward net revenue retention, market share growth, customer satisfaction, and employee productivity rather than raw new logo acquisition.
Read that as a warning about where your constraint is likely to be. If you are past the earliest stage and still allocating almost everything to the top of the journey, you are funding the stage that used to be binding rather than the one that is.
Most of the buying happens without you
The third difference: the majority of a B2B purchase happens in rooms you are not in. Independent research, internal debate, a spreadsheet you never see. During that period your content is doing the selling in your absence, or it is absent too.
That reframes content from a nurture asset into a distribution problem, which matters later when we look at what to do if visibility turns out to be the constraint.
Together these explain why a generic funnel audit gives a B2B SaaS team a confident but wrong answer. It counts people instead of accounts, so the stage numbers are distorted before the analysis starts. Correct that and the same table produces a different constraint.
Which stage is capping growth, and how do you find it?
Here is the procedure, and it takes an afternoon rather than a quarter. You are looking for one thing only: the stage where accounts fall out fastest relative to what that stage used to do.
Everything else in this article depends on getting this step right, so do it with real numbers rather than from memory.
Walk the journey stage by stage
List the stages an account moves through with you. The specific naming matters less than covering the whole path, from first exposure through to expansion. If you want a fuller treatment of the stages themselves, the customer value journey breaks them down properly.
Then put two numbers on each stage: how many accounts entered it in the last full quarter, and how many advanced to the next one.
| Stage | Accounts in | Accounts advanced | Rate | Rate last year |
|---|---|---|---|---|
| Aware | ||||
| Engaged | ||||
| Qualified | ||||
| Sales accepted | ||||
| Opportunity | ||||
| Closed won | ||||
| Renewed | ||||
| Expanded |
Accounts, not people. If your systems cannot produce account-level numbers, that is itself a finding, and it is a common one. Fixing the measurement is sometimes the first quarter’s work.
Look for the steepest drop, not the smallest number
Your constraint is the stage where the drop is steepest relative to what that stage should do, and relative to what it did last year. The worst absolute number is usually a decoy.
A stage that converts at four percent may be fine if that stage always converts at four percent. A stage that fell from thirty percent to eighteen is the one bleeding, even though eighteen sounds healthier.
Three things that make this harder than it reads:
- The constraint is rarely where the noise is. Teams tend to fund the stage they enjoy working on, which is usually near the top, because it is creative and it produces visible artifacts. The stage that is actually binding tends to be the boring one nobody wants to own.
- Visibility is one of the stages. If accounts never enter at the top, every downstream number is starved and your diagnosis will keep pointing at the first row. That is a real constraint and it gets funded like any other, which usually means B2B SEO strategy and earning citations rather than adding another channel.
- One constraint at a time. Two priorities is zero priorities. Pick the worst one, write it down, and resist the urge to hedge by funding the second worst as well.
The output of this exercise is one sentence: the stage capping our growth right now is X. If you cannot write that sentence, you are not ready to allocate budget, and no tactic list will rescue you, because every item on the list assumes a diagnosis that has not happened.
Worth saying what this is not. It does not require you to solve attribution first. Attribution asks which touch deserves credit, a question many B2B SaaS teams spend years failing to answer. The table asks something easier: did this account move to the next stage, yes or no. Imperfect data answers that.
Is the constraint even inside marketing?
Run the table honestly and a specific row goes red more often than any other. It is the one between qualified and sales accepted, where marketing hands an account across to sales and the account stops moving. Most marketing plans never examine that row, because it does not belong to marketing alone.
You are not unusual if it is yours. The Digital Bloom’s 2025 B2B SaaS funnel benchmarks name that step the key bottleneck in the funnel, with average conversion between fifteen and twenty-one percent.
This is the handoff, and in a sales-assisted motion it is where growth quietly dies. Accounts that marketing counts as qualified, sales never works. Or works three weeks late, when the buying committee has already moved on.
Or works and rejects, without a feedback path that changes what marketing qualifies next month.
Two diagnostics tell you quickly:
- What share of marketing-qualified accounts receive a first sales touch inside your target window? If your target is 48 hours and reality is nine days, you have found something.
- What share does sales actually accept and work? A high qualification rate paired with a low acceptance rate points at your qualification definition rather than your volume, and pushing more volume through it makes the gap wider.
If the constraint lives here, more campaign spend cannot fix it. Worse, it will make your reporting look better while the business gets no benefit, because you will generate more of the thing that is already not converting.
Now the uncomfortable part. This finding lands as a political object inside your company before it lands as an analytical one. It sits across an ownership line. Marketing cannot fix sales capacity or follow-up discipline. Sales cannot fix qualification criteria they did not write.
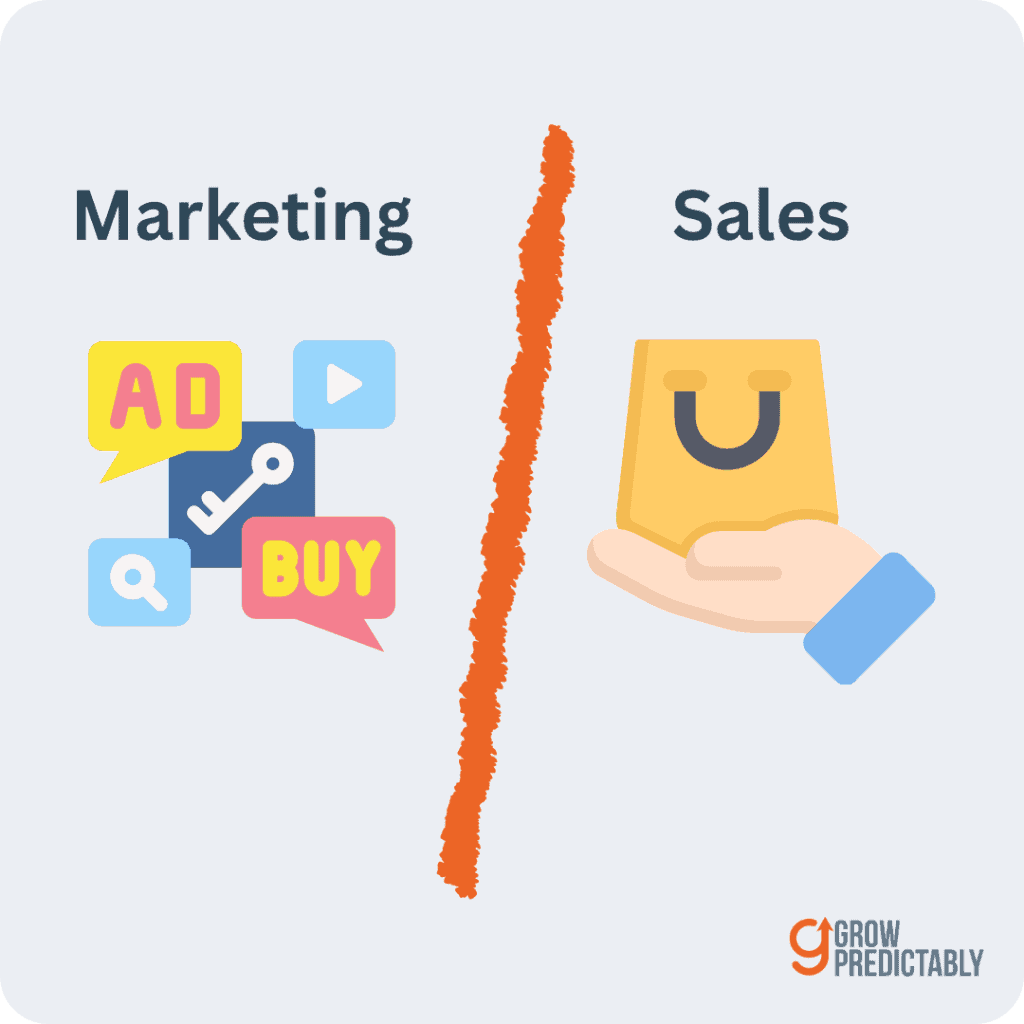
So the stage that is capping growth is the one stage nobody owns, and the default outcome is that each side points at the other for another two quarters.
The fix here is organizational rather than analytical. Name one person accountable for the handoff as a stage, give them authority spanning both functions, and give them the quarter to move it. That is a decision only the founder or CEO can make, which is why this diagnosis has to travel upward rather than sit inside a marketing plan.
Is it an acquisition problem or a retention problem?
If the handoff is clean, the next fork is the one most teams get wrong, because they read a benchmark without reading the fine print underneath it. The question sounds simple: are you failing to win customers, or failing to keep the ones you win? Answering it the wrong way costs a full year of budget.
The payback test, read against your ACV
CAC payback is the standard measure of acquisition efficiency: how long it takes to earn back what you spent to win a customer. The trap is treating it as a universal number.
The 2026 SaaS and AI Performance Benchmarks from Aleph and Benchmarkit, drawing on 342 B2B SaaS and AI-native companies with payback figures from the 198 that reported the metric, put the 2025 median at roughly 16 months, with the top quartile at 6 months or less.
The report segments its figures by contract size, and that segmentation is the point. A twelve-month payback can be comfortable for one contract size and alarming for another.
Which means “is our payback bad?” is unanswerable as asked. The question is whether your payback is bad for your ACV tier, and whether it is getting longer. A lengthening payback at your own tier, with retention holding steady, points at acquisition efficiency as the constraint. If you want the underlying arithmetic, customer acquisition cost and lifetime value are broken down separately.
For a wider view of what the spending side looks like across the market, Benchmarkit’s 2025 B2B Marketing Benchmarks, compiled from 323 B2B technology companies, is the most useful reference point for marketing budget and productivity ratios.
The expansion test
Now look downstream. If retention or expansion is the soft spot, additional acquisition spend does not just fail to help. It actively hurts, because you are filling a leaking bucket faster and paying full price for every unit that leaks out. Churn benchmarks give you something to read your own numbers against.
Land-and-expand complicates this usefully. In B2B SaaS the second sale often happens inside an account that has already renewed once, which means expansion revenue and retention are the same motion viewed at different moments.
If your net revenue retention is soft, the constraint may sit in onboarding or in the first ninety days, long before anyone would call it a marketing problem.
The rule of thumb is short enough to remember in a budget meeting: an acquisition constraint means spend more to get more, while a retention constraint means spending more makes the chart worse.
Getting this fork wrong is the most expensive mistake on this page, because the two failures look identical on a revenue graph for about two quarters before they diverge sharply.
There is a tell worth watching for. When the constraint is retention but the team believes it is acquisition, the symptom is that every acquisition experiment works briefly and then stops mattering. New logos arrive, the chart ticks up, and three months later the total is flat again.
If that pattern is familiar, run the expansion test before you approve another acquisition budget.
How do you fund the constraint and starve the rest?
The allocation rule is one sentence: concentrate spend at the constraint until it stops being the constraint, then re-diagnose, because by then it will have moved somewhere else. Simple to state and genuinely difficult to execute, because the second half asks you to take money away from work that is producing visible results.
The hard half is the second clause. Underfunding everything else is not neglect, it is the mechanism. Effort spent at a stage that is not binding does not show up in output. It shows up in activity reports, which is precisely why it survives budget reviews.
In practice a quarter shaped this way looks like:
- One funded bet. The constraint stage, with the incremental budget, a named owner, and a target for the specific conversion rate you are trying to move.
- Two maintenance lines. Things that must keep running so the machine does not seize. Held flat, explicitly, with the number written down.
- Everything else paused, in writing. Named, with the reason, and with a note about what would bring it back.
That last line is what makes it a strategy rather than a preference. A pause you did not write down is a thing that creeps back at half strength within six weeks.
Expect resistance, and expect it to be reasonable. The person running the paused channel is not wrong that it produces results. They are just not the constraint this quarter.
That is the conversation the diagnosis exists to make possible, because it moves the argument from whose work matters to which stage is binding, and the second question has an answer.
Then re-run the table next quarter. A constraint that has been properly funded stops being the constraint, and the whole point is that the answer changes. A strategy that gives the same answer three quarters running has usually stopped being a diagnosis and become a preference.
Two failure modes are worth naming, because both look responsible from the inside.
The first is hedging. The constraint gets sixty percent of what it needed, because taking the full amount from other lines felt too aggressive, and the second worst stage gets the rest so nobody feels abandoned.
Neither stage clears the bar where anything changes, and at the end of the quarter the honest conclusion is that the diagnosis was wrong. It was underfunded, which is a different problem with the same-looking chart.
The second is declaring victory early. The rate ticks up for a month, the team relaxes, and spend drifts back before the improvement is structural. Give the funded stage the full quarter, and hold the pause list until you have two consecutive periods of movement.
Both come from the same instinct, a reasonable dislike of concentration. Concentration is legible: if the bet is wrong, everyone can see whose bet it was. Spreading budget evenly feels safer because failure becomes diffuse and unattributable.
Naming that out loud in the room is usually what breaks the pattern.
Where should you start this quarter?
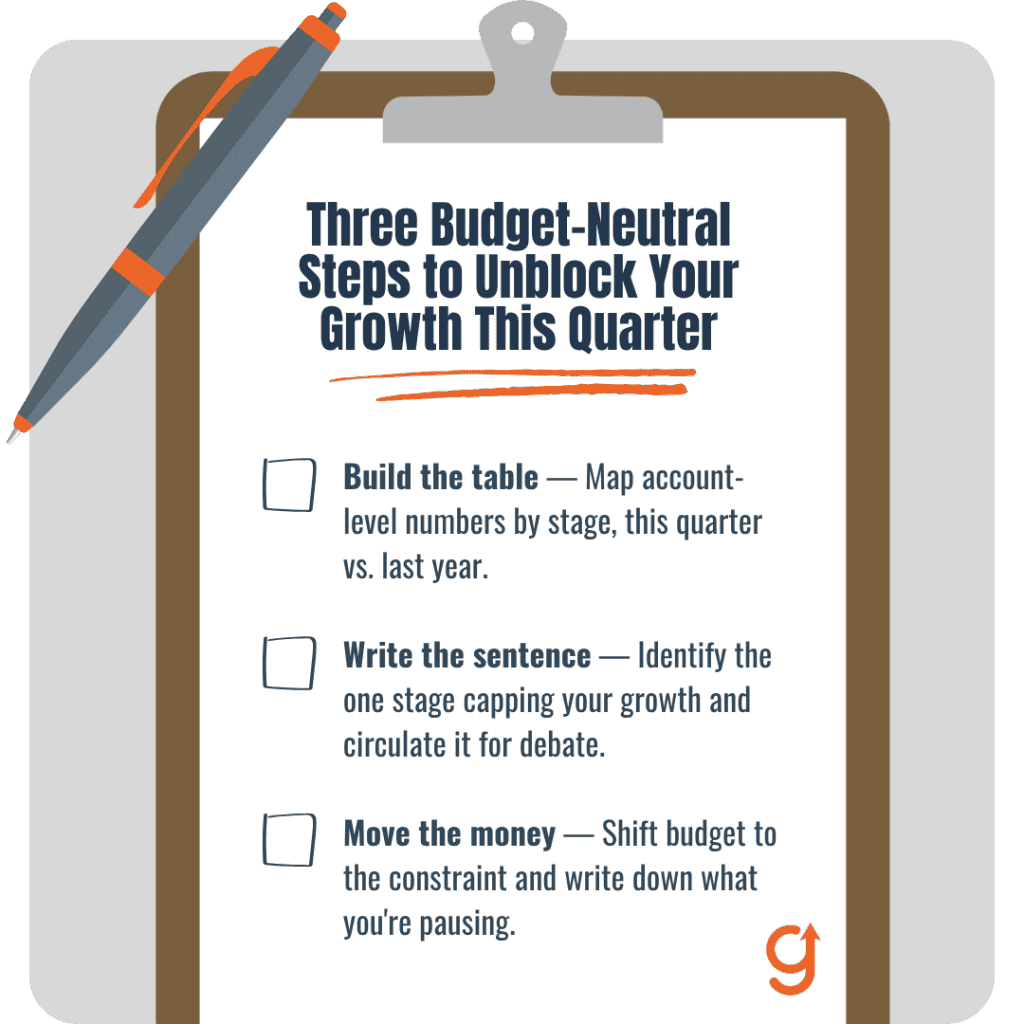
Three steps, and the first one takes an afternoon rather than a planning cycle. None of them requires new budget, new headcount, or a new tool, which is deliberate: the whole argument of this article is that the expensive part is the decision rather than the execution.
- Build the table. Account-level numbers, every stage, this quarter against the same quarter last year. If the data does not exist at account level, fixing that is step one and it is worth the quarter.
- Write the sentence. The stage capping our growth right now is X. One stage. Circulate it to whoever owns the number, including outside marketing, and let them argue. The argument is useful. The absence of a sentence to argue about is what has been costing you.
- Move the money, and write down what stops. The pause list is the part everyone skips and the part that makes the rest work.
A reasonable objection is that you do not have clean enough data. Almost nobody does. The table tolerates rough numbers, because you are looking for a steep relative drop rather than a precise rate, and a stage that fell by half shows up clearly even in messy data. Waiting for clean data is an expensive form of doing nothing.
The second objection is that the constraint might sit outside marketing, which makes it awkward to raise. That is precisely why the diagnosis is worth running. A marketing team quietly absorbing blame for a handoff problem resolves in exactly one way, and it is not a good way.
The table gives you something better than an opinion to bring to that conversation.
The cost of not choosing is undramatic, which is precisely why it persists. It is another quarter of six channels at partial strength, a team that is genuinely working hard, and a chart that looks exactly like this one.
Nothing fails loudly enough to force a decision, so no decision gets made, and the pattern repeats until something external forces it. That is the expensive outcome, and it does not announce itself.
If you would rather not build the table from scratch, the Double Your Sales Assessment scores your growth across four pillars and tells you which one is holding you back, using the diagnostic-first approach behind Growth Gap Marketing. It takes a couple of minutes, and it hands you a starting point for the one sentence that is the only genuinely hard part of a strategy.
Frequently Asked Questions
What is a B2B SaaS marketing strategy?
A B2B SaaS marketing strategy is a decision about where to concentrate finite budget across the stages a buying account moves through, from first exposure to renewal and expansion. It has to name three things: which single stage is capping growth, where the next increment of budget goes, and the one metric that proves it moved. If it does not say what you will stop funding, it is a plan rather than a strategy.
How is B2B SaaS marketing different from self-serve SaaS marketing?
Three structural differences. A committee decides rather than a person, so conversion has to be measured at account level, not by individual clicks. The sale is sales-assisted, so there is a handoff stage that neither marketing nor sales fully owns. And revenue arrives over time, so an acquisition win with weak retention is a loss booked slowly. Self-serve plays applied to a committee purchase measure the wrong thing.
How do I create a B2B SaaS marketing plan?
Start with a diagnosis, not a channel list. List the stages an account moves through, record how many accounts entered and advanced at each stage last quarter, and find where the drop is steepest relative to its own history. Write one sentence naming that stage. Then concentrate the next increment of budget there, name an owner, and write down explicitly what gets paused to pay for it.
Which marketing channel should a B2B SaaS company start with?
The question cannot be answered from a channel list, because the right channel depends entirely on which stage is currently capping growth. If accounts never enter the journey, visibility work comes first. If qualified accounts stall before sales works them, no channel fixes it. Diagnose the binding stage first, then choose the instrument that treats that specific stage.
What is a good CAC payback period for B2B SaaS?
It depends on your contract size, which is why a single universal benchmark misleads. Aleph and Benchmarkit’s 2026 benchmarks, drawn from 342 companies, put the 2025 median at roughly 16 months with the top quartile at 6 months or less, and segment their figures by contract size. Judge your number against your own tier, and watch the direction of travel more than the absolute figure.
How do you measure B2B SaaS marketing success?
By whether the stage you decided to fund actually moved. Pick the conversion rate at the constraint stage before the quarter starts, measure it at account level, and compare against the same period last year rather than the previous month. Channel-level activity metrics tell you what happened but not whether it mattered, because effort spent at a non-binding stage does not show up in output.
How often should you revisit your B2B SaaS marketing strategy?
Re-run the diagnosis quarterly. A constraint that has been properly funded stops being the constraint, so the answer should change over time. If your diagnosis returns the same stage three quarters running, either the stage was never properly funded or the exercise has stopped being a diagnosis and become a preference.