Measuring Marketing ROI in B2B SaaS the Right Way
TL;DR: Marketing ROI in B2B SaaS is the return on your whole acquisition-to-retention engine, not the score on each channel. Most teams compute ROI on the acquisition event while the real value gets decided after the sale, so a green dashboard hides a leak two links down the chain. Measure the engine, not the channels, and find the one number that’s the constraint.
Key Takeaways:
- Channel ROI can read positive on every campaign while company revenue stays flat, because most ROI math is computed on acquisition and the value of a B2B SaaS customer is decided after the sale.
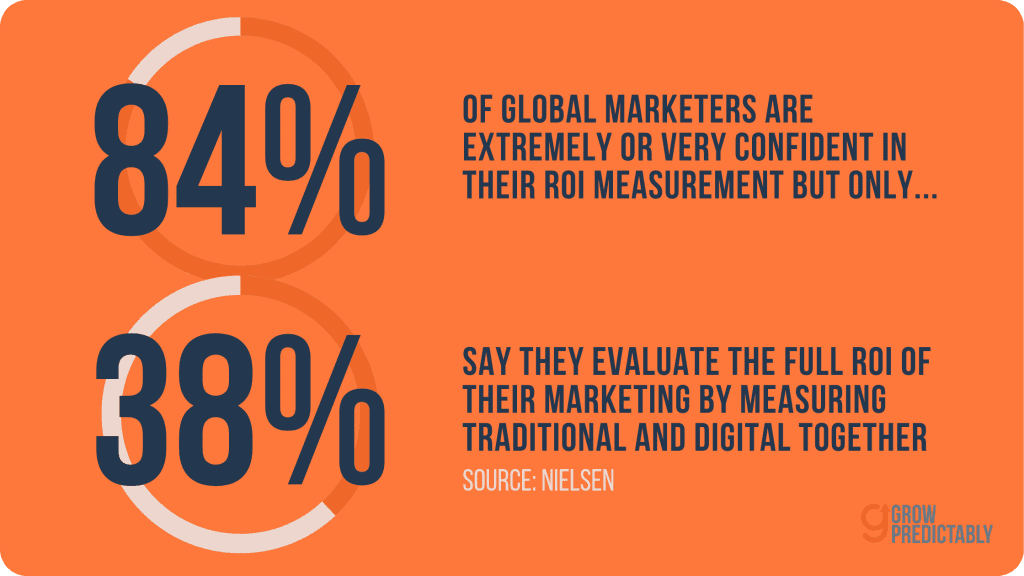
- The Nielsen 2024 Annual Marketing Report found 84% of marketers are extremely or very confident in their ROI measurement, yet only 38% evaluate ROI across both traditional and digital marketing together.
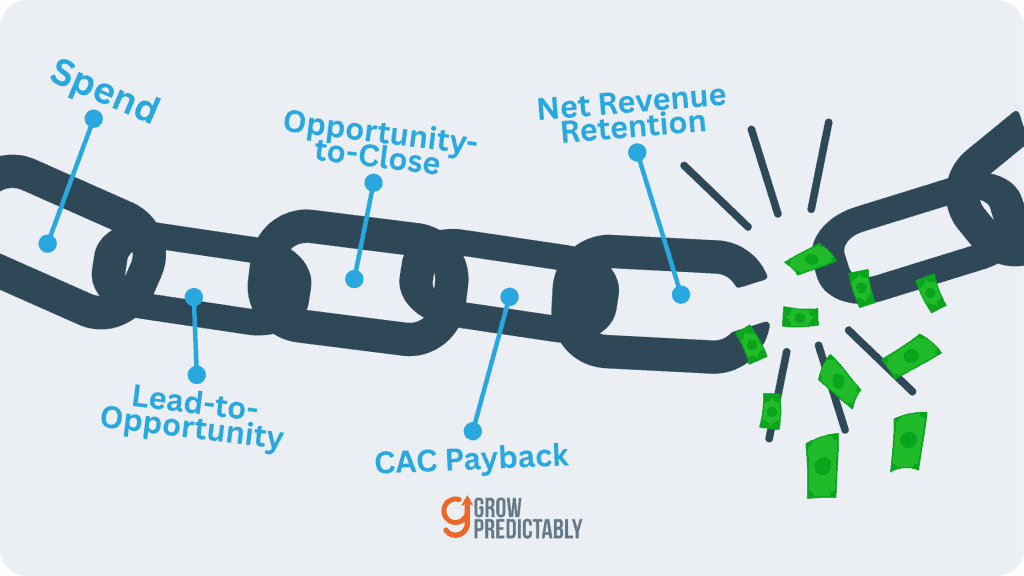
- The marketing ROI chain runs from spend through lead-to-opportunity, opportunity-to-close, CAC payback period, and net revenue retention, and the only honest reading is the whole chain, not one link.
- Net revenue retention is the metric most teams underweight, and Bessemer’s State of the Cloud benchmarks put it at 100% (good), 110% (better), and 120%+ (best).
- Find the single constrained number, build a connected measurement spine around it, automate the report, then make the weekly review a habit so growth becomes automatic.
I’ve sat in the quarterly review where every channel reports a positive return and the CEO still asks why revenue hasn’t moved. The dashboards are green. CAC looks fine. And the room goes quiet, because nobody can connect those numbers to the flat line on the revenue chart. I’ve run the A/B tests, built the dashboards, and tied the spend to pipeline at companies from a major airline to an enterprise B2B SaaS company, and the same pattern shows up every time. The number that looks healthiest is usually measuring the wrong thing. This piece walks the four moves I use to fix that: diagnose the one number that’s your real constraint, build a connected measurement spine around it, automate the report, and make the weekly review stick.
If you’re a B2B SaaS founder or marketing leader staring at green campaign dashboards while growth sits flat for a quarter, this is for you, especially if you’re about to defend the budget with numbers you privately don’t trust. What follows is what diagnose-first looks like at the ROI layer: not another metrics checklist or attribution tutorial, but the one move that tells you which single number is leaking your return before you spend another dollar optimizing the wrong channel.
Why does your marketing ROI look fine while growth stays flat?
Your marketing ROI looks fine while growth stays flat because the number is scoring your channels, not your company. Every campaign reports a positive return on the acquisition event, so the average looks healthy. Meanwhile the value of a customer is decided later, after the sale, where the dashboard isn’t looking.
This is the trap I see most often. A team pulls up the paid-search report, the email report, the webinar report, and each one shows revenue per dollar that beats the threshold. The reflex is to optimize the winners harder and add a channel or two to lift the average. That’s scorekeeping for random acts of marketing. You’re tracking the parts while the engine quietly leaks. If the underlying growth strategy is a pile of disconnected campaigns, this is the same failure pattern behind why B2B SaaS growth strategies fail, measured one campaign at a time.
Scorekeeping for random acts of marketing
Per-channel ROI answers a small question well. It tells you which ad set or email sequence earned back its cost in the moment. It can’t tell you whether a dollar of marketing turns into durable revenue, because it stops counting at the conversion. A great-looking channel return on a base that churns hard is a vanity number with a confident face.
The confidence-versus-reality gap
Here’s how wide that gap can run. The Nielsen 2024 Annual Marketing Report found that 84% of global marketers are extremely or very confident in their ROI measurement, yet only 38% say they evaluate the full ROI of their marketing by measuring traditional and digital together. So most teams feel sure about a number that covers a slice of the picture. Great leaders crave clarity, and a green dashboard isn’t clarity. It’s a confident reading of the wrong gauge.
What does it mean to measure the engine instead of the channels?
Measuring the engine means asking whether your whole system turns a dollar of marketing into durable, compounding revenue, instead of asking whether each channel earned its keep this month. Channel ROI scores a link. Engine ROI scores the chain from spend all the way through retention.
The difference matters because of where the money is actually made. In SaaS, the first payment rarely covers the cost to acquire the customer. The return shows up over months of subscription, and it depends entirely on whether that customer stays and expands. A high channel ROI sitting on top of a leaky base is the marketing equivalent of bragging about how fast you’re filling a bucket with a hole in it.
Channel ROI versus engine ROI
Think of your ROI as a chain, not a single figure. A dollar enters at the top as traffic and spend, moves through lead-to-opportunity and opportunity-to-close, picks up a payback clock at the sale, then either compounds or leaks after the sale through net revenue retention. Engine ROI reads the whole chain. Channel ROI reads one link and assumes the rest is fine.
The constraint usually hides after the sale
This is where most teams misdiagnose. Retention is the true growth problem dressed up as an acquisition problem. Harvard Business Review, citing the Bain research of Frederick Reichheld, reports that increasing customer retention rates by 5% increases profits by 25% to 95%, and that acquiring a new customer is anywhere from five to 25 times more expensive than retaining an existing one. So when growth stalls, the constraint is usually a downstream leak in retention or expansion, which means your acquisition ROI can look perfect while the engine loses money. ROI is a retention question wearing an acquisition costume.
That leak you’re seeing is a growth gap, the same one defined in what a growth gap is in B2B SaaS, showing up specifically in your ROI math. And once retention is the constraint, the fix lives in a different discipline entirely, which is how to reduce churn in SaaS, not in another round of channel optimization. One number is throttling the engine. Find it before you optimize anything else.
How do you find the one number that is your real constraint?
You find your real constraint by reading the ROI chain end to end and locating the single number that, if fixed, would move company-level ROI the most. Stop building inventory across every channel and find the constraint. Everything else is noise this quarter.
The move is a diagnosis, and it happens before you touch the budget. Pull the chain apart link by link and ask where the value actually leaks.
The diagnose step
Walk the chain in order and put a real number on each link:
- Traffic and spend at the top. Are you getting enough qualified attention for the dollars in?
- Lead-to-opportunity. Do leads become real, sales-accepted opportunities, or do they stall?
- Opportunity-to-close. Do opportunities turn into customers at a rate the spend can support?
- CAC payback period. How many months until a customer earns back what you paid to acquire them?
- Net revenue retention. Once they’re in, does their value compound or erode?
The constraint is the link where the chain is weakest relative to where it needs to be. Fix that one and the whole engine moves. Pour effort into a healthy link and you’ve spent money to make a strong part stronger while the weak part still caps everything.
Read the chain, not the channels
Notice what this isn’t. It isn’t a ranking of your channels by ROI. Two teams can have identical channel reports and completely different constraints, because the constraint is rarely at the top of the funnel. The anti-pattern is spreading budget across more channels to lift the average ROI, or optimizing the top channel harder. Both treat the symptom and fund the leak faster. Use the data to identify the gap first, then test against that one number.
What does a connected ROI measurement spine actually include?
A connected ROI measurement spine is a small set of metrics, each tied to a lifecycle stage instead of a campaign, that lets you read the whole chain in one place: CAC, CAC payback period, LTV-to-CAC, pipeline contribution, gross churn, and net revenue retention. Tied together, they tell you where the engine leaks. Listed separately on different dashboards, they tell you nothing.
The point of a spine is connection. Most teams already track these numbers. They just track them in six tools that never talk, so no one can read the chain as a chain.
CAC payback period and LTV-to-CAC
CAC payback period is the fully loaded cost to acquire a customer divided by the monthly gross-margin-adjusted revenue that customer brings in. It answers one question: how many months until you’ve earned back what you spent. Under 12 months is a common healthy anchor. LTV-to-CAC compares the lifetime value of a customer to what it cost to acquire them, and teams usually aim for roughly 3 to 1. Both numbers do something channel ROI can’t. They expose a leak. I’ve watched a channel report look great until CAC payback showed the acquired cohort never actually paid back inside the year, which meant every “winning” campaign was quietly losing money.
Net revenue retention as a first-class ROI metric
Net revenue retention is the metric most teams underweight, and it’s the one that decides whether your acquisition ROI compounds or leaks. It measures whether your existing customer base grows or shrinks in revenue over a period, before any new sales. The Bessemer State of the Cloud 2023 fundability benchmarks put net revenue retention at 100% (good), 110% (better), and 120%+ (best). Below 100% and your base is shrinking, which means you’re spending acquisition dollars just to stand still. Read alongside CAC payback, NRR turns a vanity-prone ROI number into an honest one.
This is also the shift serious operators and investors are making. As Daniel McCarthy, assistant professor of marketing at Emory’s Goizueta Business School, and Peter Fader, the Frances and Pei-Yuan Chia Professor of Marketing at The Wharton School, put it:
This approach is driving a meaningful shift away from the common but dangerous mindset of “growth at all costs,” towards revenue durability and unit economics.
That’s the whole case for the spine in one line. Durable unit economics beat raw growth, and you can’t manage durability you don’t measure.
Tie every metric to a lifecycle stage
Here’s the spine as a paste-ready table you can build this week:
| Metric | Lifecycle stage it measures | What a leak here looks like |
|---|---|---|
| Traffic and qualified spend | Awareness | High cost per qualified visit, thin pipeline at the top |
| Lead-to-opportunity rate | Interest and consideration | Leads pile up, opportunities don’t |
| Opportunity-to-close rate | Decision | Pipeline looks full, bookings stay flat |
| CAC payback period | Acquisition economics | Customers don’t pay back inside 12 months |
| Net revenue retention | Retention and expansion | Existing base shrinks, acquisition ROI never compounds |
When you need the full catalog of what to instrument beyond this core, the complete set lives in B2B SaaS marketing metrics to track. The spine is the subset that reads the chain. The proof this works in practice: at an enterprise B2B SaaS company, connecting the web measurement across teams instead of reporting channels in isolation lifted Contact Sales pipeline by 68%, because the team could finally see where the real opportunity was.
How do you automate the ROI report so it runs without a babysitter?
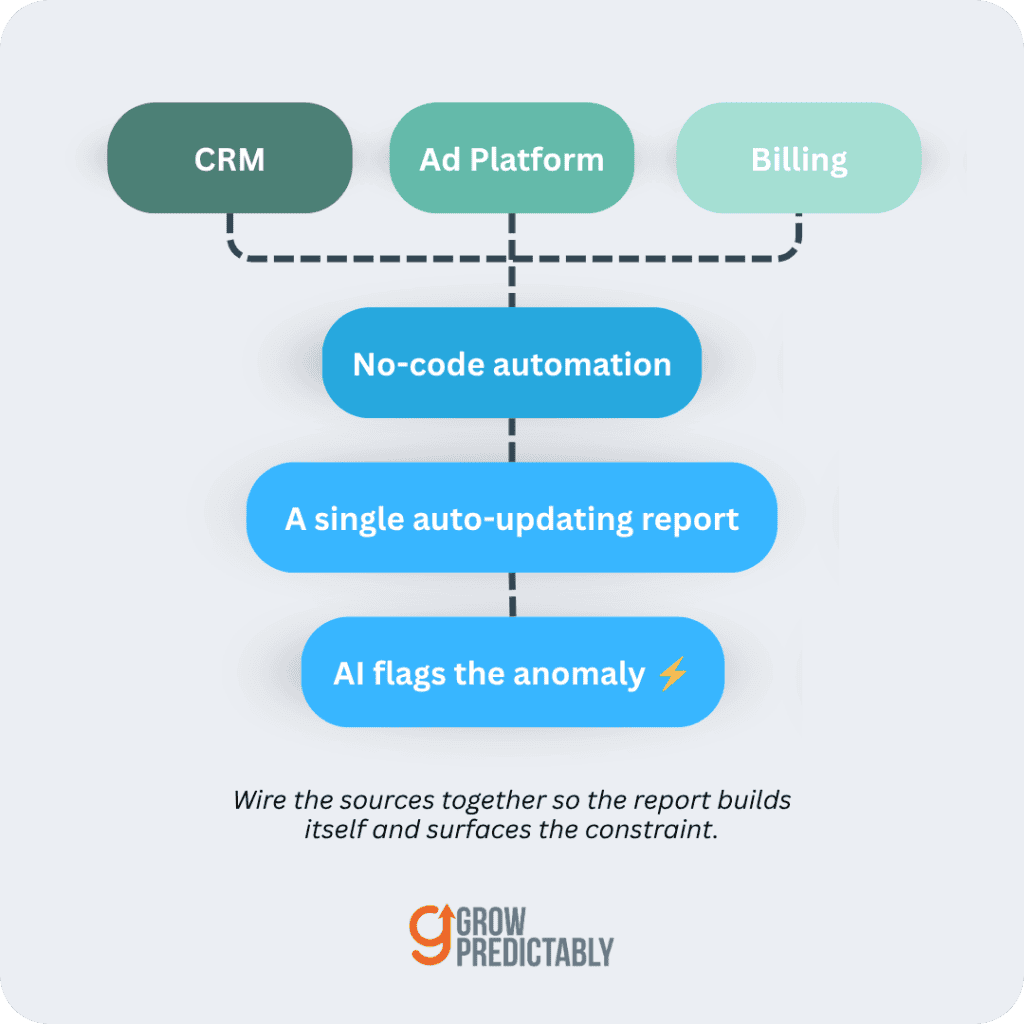
You automate the ROI report by wiring AI and no-code tools to pull the spine on a schedule, calculate the chain, and surface the constraint, so the report builds itself instead of a person rebuilding a spreadsheet every Monday. The goal is a spine that updates itself and flags what changed.
There are two kinds of automatic here, and the first sets up the second. The machine kind is the report running itself. The human kind, which comes in the next section, is the team acting on it without being chased. Get the machine kind working first.
AI plus no-code instead of a manual spreadsheet
You don’t need a new platform to do this. Reporting tools like HubSpot and Salesforce already hold most of the data. The differentiator is your method for connecting it. Wire the sources together with no-code automation, then let AI flag the anomaly and draft the plain-language narrative of what moved and why. AI is a teammate that surfaces the signal and writes the first draft of the story, not a vending machine you trust blindly. I lean on this through a Make.com AI and automation practice, and the rule is simple. The machine handles the pull and the math. The human keeps the judgment.
What to automate first
Don’t try to automate the whole dashboard on day one. Start with the one metric that’s your constraint. Automate that pull, that calculation, that alert, and prove the loop works before you expand. A fully automated dashboard nobody reads is still zero ROI. If you want to treat the automation itself as an investment with its own return, that’s a discipline of its own, covered in the ROI of marketing automation in B2B SaaS.
How do you make the measurement actually stick on the team?
You make the measurement stick by designing a weekly metric-review habit, a fixed time with one owner where the constraint number sits on top and every review produces one decision. The system only works if the team uses it, and use is a behavior you design, not a memo you send.
The old advice was “do a Monday metrics review.” That’s a tip, not a habit. A habit has a specific shape, and shaping behavior on purpose is its own craft.
The weekly metric-review habit
Give the review four things and it sticks. A fixed time, so it never competes for a slot. One owner, so it never becomes nobody’s job. The constraint number on top, so the meeting stays about the one thing that matters. And a rule that every review ends with one decision, so it produces motion instead of admiration. As a Tiny Habits Certified Coach trained in the BJ Fogg method, I design these reviews as small, anchored behaviors that fit into a week someone is already living. The method is what makes the cadence survivable.
Design the cadence you will actually keep
The right cadence is the cadence you’ll keep. A fifteen-minute weekly review you actually run beats a flawless monthly deck nobody opens. Pick the rhythm your team will repeat, anchor it to something that already happens, and keep the scope tight. That’s how the machine kind of automatic from the last section becomes the human kind, where growth becomes automatic because the watching and deciding happen on their own.
What does this look like with real numbers?
Here’s the pattern with verified numbers from work I’ve led. The thread through all of it is the same: find the one constrained number, instrument it, test against it, and review it, instead of optimizing every channel at once.
An operator walk-through
At a major airline, a single A/B test, one constrained number, drove a 14.1% uplift in sales and a 13.2% lift in loyalty-membership signups. Not a dozen simultaneous channel experiments. One test, aimed at the link that mattered. That’s the diagnose-then-test loop working: identify the gap with data, then test against it, rather than spreading effort thin and hoping the average moves.
Channel ROI looked fine until payback told the truth
At an enterprise B2B SaaS company, the same discipline showed up across the spine. A redesigned landing page test lifted conversion by 83%. A multi-team optimized web experience lifted Contact Sales pipeline by 68%. And a custom dashboard built around the right metrics tied to roughly $2M in marketing-originated pipeline for an AI initiative. Each of those wins came from finding the one number, building the measurement around it, and reviewing it, not from a heroic effort to optimize everything. That’s the engine measured the right way.
How do you measure marketing ROI in B2B SaaS the right way?
You start with a diagnosis, because you can’t fix what you haven’t found, and in B2B SaaS the constraint is rarely where the dashboard points. The first concrete move is to read your ROI chain end to end, from spend through CAC payback to net revenue retention, and name the single weakest link relative to where it needs to be. That one number is your constraint. Build your spine around it, automate the pull, and put it on top of a weekly review. Everything else can wait a quarter. If you want the fastest way to see which number is leaking your return, run the free scan before you spend another dollar optimizing the wrong channel.

A solid 15 years of Digital Marketing | AI & Automation | SEO & Content Marketing Strategy | Customer Value Journey.
Experience with businesses big & small: Globerunner (SEO & marketing agency), PowerSchool (B2B SaaS), PFSweb (e-commerce), Southwest Airlines (travel), and Mary Kay (beauty & skincare).