

B2B SaaS Customer Retention Metrics That Matter

TL;DR: Three metrics describe retention when your customers are companies on annual contracts. Logo retention, gross revenue retention, and net revenue retention. Read all three by contract cohort, which is a lens rather than a fourth metric. Retention lists borrow measures from retail that cannot see a renewal event. Fix gross revenue retention before net revenue retention, because expansion can mask a leak instead of repairing it.
Key Takeaways
- Logo retention counts how many of the accounts you already had are still here. New accounts signed this period are not part of it, and the contract value is invisible to it.
- Gross revenue retention can never exceed 100 percent, which is exactly what makes it the honest leak detector.
- Net revenue retention blends two different things. Expansion that took a real commercial decision, and contractual uplift that took none.
- Cohort is a lens you apply to all three numbers, grouped by the quarter an account signed, not a metric that stands beside them. Read that way, expect no single good rate, because the number tracks contract size.
- Four measures that appear on retention lists describe a shop rather than a book of contracts. One of them, days sales outstanding, is a real finance metric filed under the wrong heading.
Why do B2B SaaS retention dashboards measure the wrong thing?
Most B2B SaaS retention dashboards measure the wrong thing because they borrow metrics built for retail transactions, not renewal contracts.
I know this because I made the mistake myself. The page you are reading replaced an earlier version of itself. That earlier version listed nine retention metrics for subscription businesses, and four of them described a shop, not a book of annual contracts. That is worth stating plainly, because it is the failure this article exists to correct, and it was published under my own name.
A retail metric answers one question: did the customer come back and buy again? A B2B SaaS metric answers a different question: did the account renew, and did the contract grow? Those questions only look similar until you try to act on the answer.
Three facts about a B2B software business drive everything downstream:
- Account count is small. You’re working with a few hundred accounts, not hundreds of thousands of individual users.
- Contract values vary wildly. Accounts span orders of magnitude in value, so they’re not interchangeable units the way retail transactions are.
- Churn shows up at renewal, not continuously. Revenue churn is recognized when a contract comes up for renewal, rather than accruing quietly through the year the way it does with recurring retail purchases.
A measure built for continuous transactions cannot see a renewal event. It will still produce a number every month, and the number will look precise, and the team will discuss it. The cost isn’t the wrong figure on a slide.
The cost is a wasted meeting, where people argue about something that was never going to move the business, and leave without a decision.
Which retention metrics actually describe a B2B SaaS business?
Three metrics actually describe a B2B SaaS business: logo retention, gross revenue retention, and net revenue retention. All three get read through one shared lens, cohort analysis by contract vintage, which is a way of reading the numbers you already have, not a fourth metric in its own right.
Keeping that lens separate matters. Treating cohort analysis as a fourth metric is its own category error.
Logo retention: Did the accounts you had renew?
Logo retention measures how many of the accounts you had at the start are still here at the end of the period. Accounts you signed during the period are not included in the calculation. That is the first thing people get wrong about it.
Its blind spot is contract value. Every account counts once, whether it pays four thousand a year or four hundred thousand. Retain ten small accounts, lose one enterprise account, and logo retention still reads as healthy while revenue falls.
In consumer software, distortion is mild because accounts are roughly comparable. In B2B, it is severe because they are not.
Logo retention answers whether your customer relationships are surviving. It cannot answer whether your revenue is.
Gross revenue retention: Is the contract base leaking?
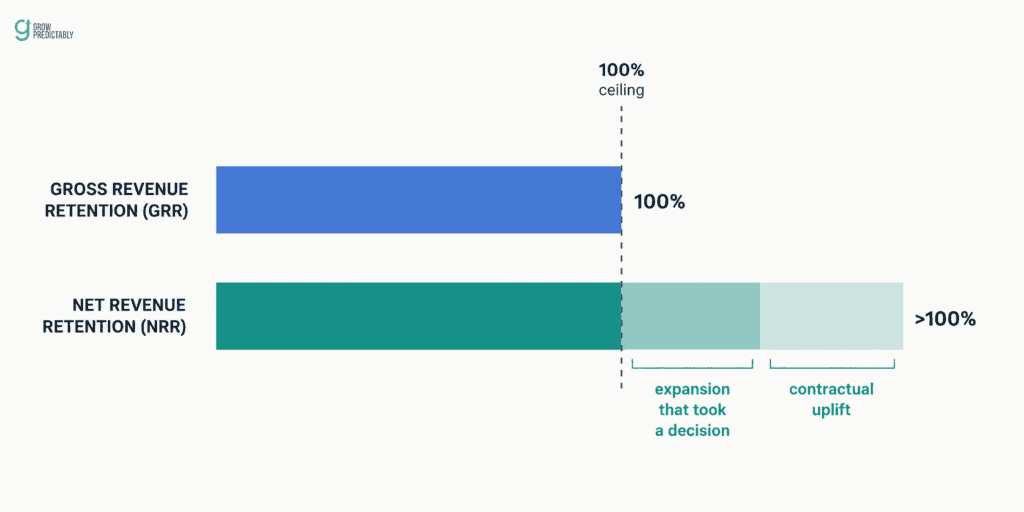
Gross revenue retention measures the revenue you kept from the customers you started with, counting churn and downgrades, and deliberately excluding expansion. Because expansion is excluded, it can never exceed 100 percent. That ceiling is the point. It makes GRR the one number that cannot be flattered.
In a contract business, it is normally recognized at renewal rather than accruing continuously. A rolling monthly churn rate built for self-serve products misreads a contract book for that reason.
Accounts do leave mid-term through bankruptcy, breach, or a negotiated exit, and those are real. They are the exception rather than the rule.
Net revenue retention: Is the base growing from within?
Net revenue retention adds expansion back in, so it can exceed 100 percent and often does. It is the growth signal, and it is the one investors ask about.
SaaS Capital’s benchmarking, drawn from more than 1,000 private B2B SaaS companies in its 14th annual survey, found that increasing NRR from the 90-100 percent range to the 100-110 percent range improves growth rate by 5 percentage points.
The part worth understanding is that NRR blends two unlike things:
- Genuine commercial expansion. More seats, another module, someone inside the account deciding to spend again.
- Contractual expansion. An annual uplift clause, or usage running over a committed tier. No decision required at all.
Both raise the number. Only one of them tells you that a customer decided you were worth more this year. Knowing which half is moving separates a real signal from a flattering one.
Reading all three by the contract cohort
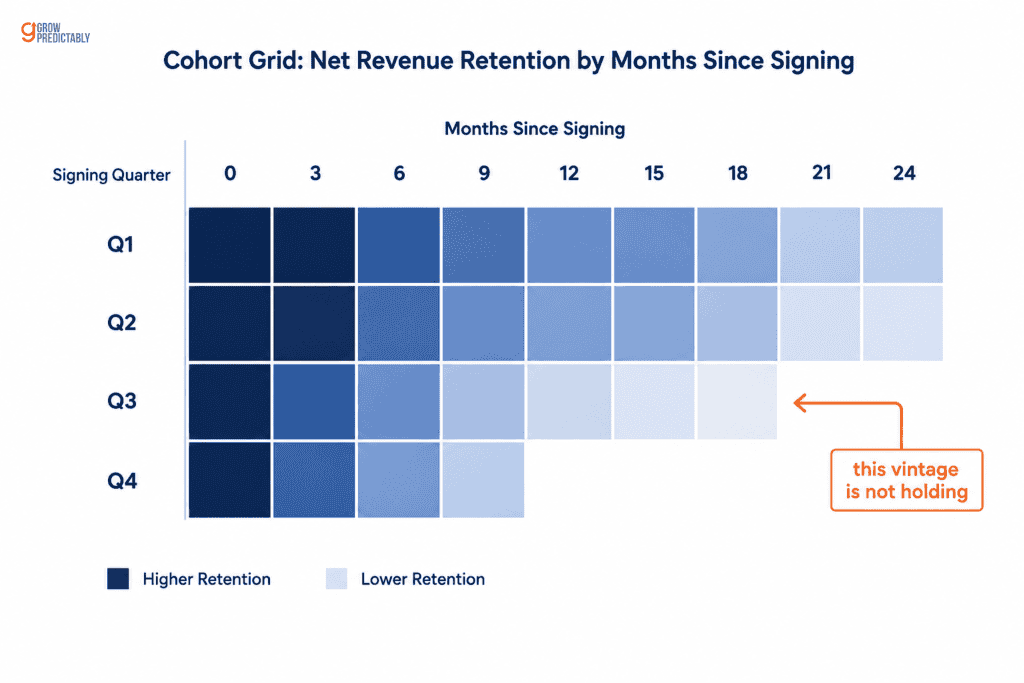
Group accounts by the quarter they signed, then read the same three numbers for each vintage.
This is what cohort analysis means in a contract business: contract anniversaries, not daily active use. It answers a question the blended figures cannot, which is whether the accounts you are signing now hold up better or worse than the ones you signed two years ago.
Stage matters here. ProductLed’s State of B2B SaaS 2025, based on assessment data from 446 validated B2B SaaS companies collected between October 2024 and March 2025, found that at the advanced stage above $4 million in revenue, key performance indicators shift toward net revenue retention, market share growth, customer satisfaction, and employee productivity. That is a finding about companies past that threshold, not a general law about scaling.
The four metrics to stop tracking on a B2B SaaS dashboard
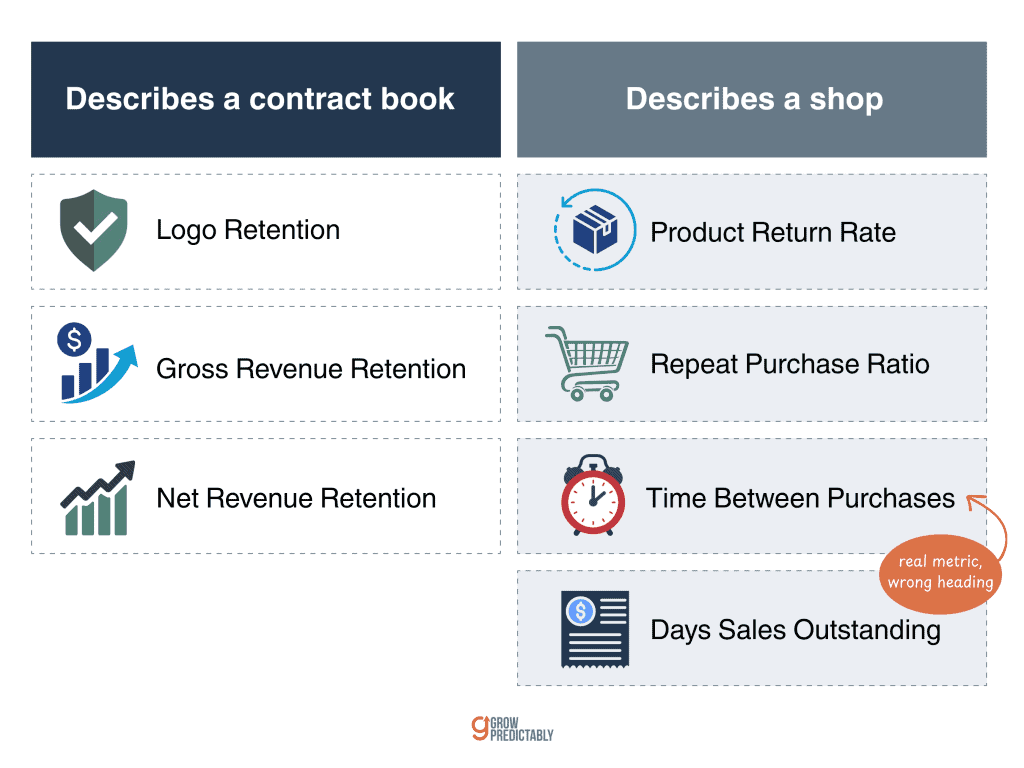
Four measures turn up on retention lists aimed at subscription businesses and do not belong there. Three are category errors. One is a real metric filed under the wrong heading, and it is the one that causes the most trouble because it looks entirely legitimate.
Product return rate. There is no physical good to return. A cancelled subscription is not a return, and treating it as one imports refund logic into a renewal decision.
Repeat purchase ratio. A renewal is not a repeat purchase. It is the same purchase continuing. Counting it as a second transaction double-counts a relationship you already had.
Time between purchases. A contract has no gap to measure. The interval is the contract term, which you set, so the metric reports your own pricing decision back to you.
Days sales outstanding. This is the difficult one. B2B SaaS genuinely invoices annual contracts and genuinely carries receivables, so DSO is a real number on a real finance report. That legitimacy is exactly why it drifts onto retention dashboards. It measures how quickly a customer pays you. It says nothing about whether they stay. A customer can pay in ninety days for a decade, and another can pay in fifteen days and leave at renewal.
I am not guessing at the difference. I built and ran an internet marketing business spanning affiliate marketing, SEO/SEM, content marketing, and e-commerce product development, so I have used return rate and purchase intervals in the businesses where they genuinely measure something. They are good metrics. They answer questions that a subscription business is not asking.
One honest exception. Usage-based and consumption-priced software does have purchase-like events, and a transactional lens can apply there. If your revenue moves with consumption rather than with a renewal date, some of this section loosens.
What counts as a good retention rate in B2B SaaS?
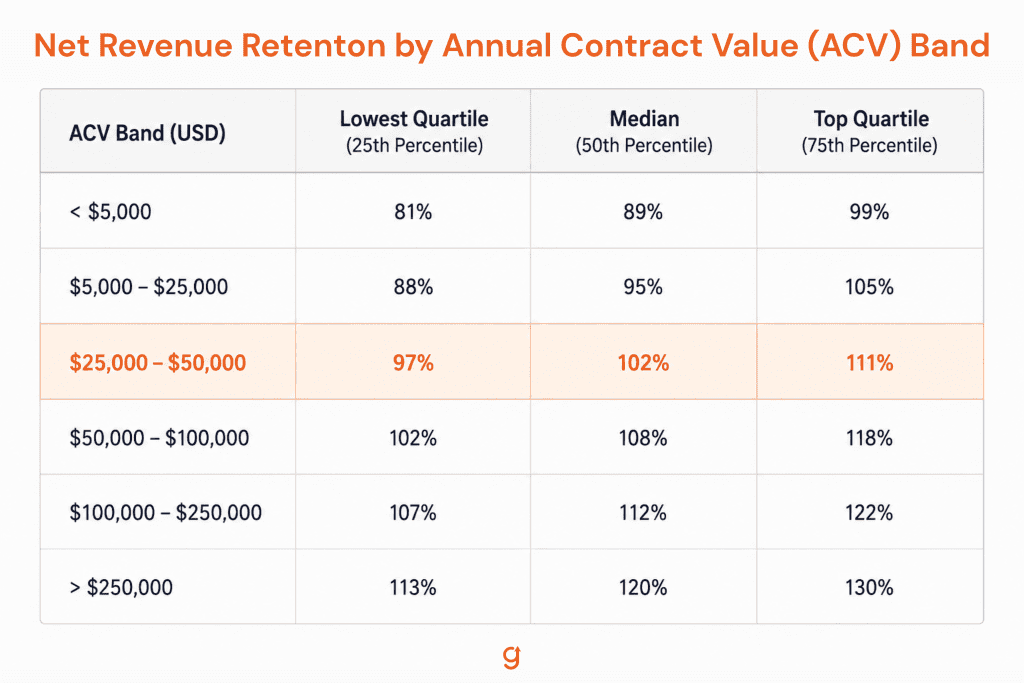
There is no single good retention number in B2B SaaS. Retention tracks contract size, so the same figure means something different depending on the band you’re in.
A 97 percent net revenue retention reads as underperformance for an enterprise book and as strength for a small-contract one. Find the band you are in before you judge your own figure.
One caveat covers the numbers below. The ACV band and Benchmarkit figures are published without a stated sample size, so treat them as directional rather than as a precise target.
Retention by contract size
- Mid-market accounts ($25,000-$50,000 ACV): SaaS Capital reports a median net revenue retention of 102 percent, with the top quartile at 111 percent and the lowest quartile at 97 percent.
- Broader market average: Benchmarkit’s 2025 performance metrics put net revenue retention at 101 percent, with gross revenue retention slipping from 90 percent to 88 percent over the past three years.
SaaS Capital’s own conclusion is the practical point here: higher net retention correlates with higher ACVs. Larger contracts retain and expand better, so a mid-market target is not an enterprise target. And across the wider market, retention is getting harder, slowly, on both measures.
The direction of the effect is well established. ChartMogul’s retention analysis of more than 2,100 businesses found that SaaS companies with net retention above 100 percent grow at more than three times the annual rate of those below 60 percent, 43.6 percent versus 13.1 percent. That analysis dates from 2022 and describes a different funding environment, so read it as evidence that the relationship exists rather than as a current growth target.
A right metric computed wrongly is still the wrong number
A metric can be defined correctly and still be calculated wrongly, and net revenue retention is where this happens most often.
The second failure mode is quieter than the first. The metric is correct, the definition is understood, and the calculation still does not match it. NRR is easy to approximate from an annual recurring revenue bridge and much harder to compute properly.
“Lazy NRR is not NRR. NRR is defined as snapshot- and cohort-based. Accept no substitutes or imitations.”
Dave Kellogg, Executive in Residence at Balderton Capital, writing at Kellblog
The two methods can print similar numbers while meaning different things, which is what makes the error survive review. One measures what happened to a defined group of customers between two dates. The other measures a net movement in the revenue total.
This bites harder in B2B than in consumer software for a reason worth naming: with a few hundred accounts, a single large renewal landing a month early or a month late moves the whole figure.
A cohort definition and a fixed snapshot date are what make the number comparable from one quarter to the next.
There is a quick test. Can you name the cohort and the snapshot date behind your NRR? If not, you are looking at a ratio rather than a retention metric, and quarter-on-quarter comparisons of it are not telling you what you think.
Which number should you fix first?
Fix gross revenue retention before net revenue retention. The advice I run into treats the three metrics as a set to improve together, and that framing hides the thing that matters most. The order you repair them in changes what you learn, and taking them in the wrong order can cost you a full renewal cycle.
The reason is mechanical. Expansion inside a handful of large accounts can lift NRR above 100 percent while the contract base underneath is still leaking.
The headline number looks healthy, and the churn is real; it simply has not surfaced yet. It arrives at next year’s renewals, all at once. That risk is highest when the expansion is a contractual uplift rather than a fresh purchase decision, because the uplift keeps arriving whether or not anyone is getting value.
Three causes of B2B churn are invisible to any usage metric, and they’re worth checking by name:
- The champion who bought has left. Their replacement has no stake in a decision they didn’t make.
- The buying committee has reshuffled. The people who valued you are no longer the people who sign.
- Procurement has scheduled a competitive re-tender at renewal. Nobody told the account team.
Work out which of the three numbers is actually constraining growth before improving all of them.
If GRR is sound and NRR is flat, you have an expansion problem, and it belongs with product marketing and the champion. If GRR itself is falling, look at whether the product still fits the accounts you are signing, which is a product-market fit question rather than a customer success one, and often a roadmap one.
This week, pick your last eight renewals and sort them into renewed, flat, expanded, contracted, and lost. Eight is enough to see a pattern and small enough to finish in an afternoon. Expansion clustered in two accounts while the rest sit flat is a very different business from expansion spread across all eight.
Where should you start?
Fewer metrics, defined precisely, fixed in order. Cut the measures that describe a shop, read the three that describe a contract book by cohort, and repair gross revenue retention before you celebrate net revenue retention.
If you want help working out which number is holding your growth back, that is the conversation to have.
Frequently Asked Questions
What is a good retention rate for a B2B SaaS company?
There is no single good number because retention tracks contract size. SaaS Capital reports median net revenue retention of 102 percent for companies with annual contract values between 25,000 and 50,000 dollars, with the top quartile at 111 percent and the lowest at 97 percent, and finds that higher net retention correlates with higher contract values. Identify your contract band before judging your own figure.
What is a good NRR for B2B SaaS?
Benchmarkit’s 2025 performance metrics put net revenue retention at 101 percent across the market. Anything above 100 percent means your existing customers are collectively spending more this year than last, which funds growth without new acquisition. SaaS Capital found that moving from the 90 to 100 percent band into the 100 to 110 percent band improves growth rate by 5 percentage points.
What is the difference between gross and net revenue retention?
Gross revenue retention counts churn and downgrades but excludes expansion, so it can never exceed 100 percent. Net revenue retention adds expansion back in, so it can. GRR tells you whether your existing base is leaking. NRR tells you whether it is growing from within. GRR is the honest leak detector precisely because nothing can flatter it.
Is the Net Promoter Score a retention metric?
No. Net Promoter Score measures stated intent, which is what a respondent says they would do. Retention metrics measure behaviour, which is what accounts actually did at renewal. NPS can be a useful leading indicator of sentiment inside an account, and it belongs on a customer experience dashboard rather than in a retention calculation.
How often should you measure retention on annual contracts?
Read gross and net revenue retention quarterly, because a rolling monthly rate built for self-serve products misreads a contract book where revenue churn is recognised at renewal. Track renewals continuously as events, then group accounts by the quarter they signed and read the same numbers per vintage. Cohort grouping is what makes quarter-on-quarter comparison meaningful.
Can net revenue retention be too high?
It can be misleading rather than too high. Expansion concentrated in a few large accounts can lift net revenue retention above 100 percent while the wider contract base is leaking, and that churn surfaces at the following year’s renewals. The risk is greatest when the expansion comes from contractual uplift rather than a fresh purchase decision, because uplift arrives whether or not anyone is getting value.